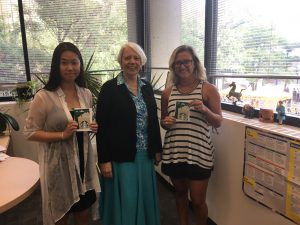
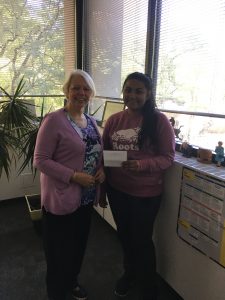
Thanks to all who took the survey & congratulations to our winners of three $50.00 Starbucks Gift Cards!
In 2016, Toronto Metropolitan University Library once again participated in LibQUAL+, an online survey used by many libraries to measure three aspects of user satisfaction:
• Information Control (hours, collections, and ease in accessing resources)
• Affect of Service (customer service)
• Library as Place (building, amenities, and study space)
Students (undergraduate and graduate), and faculty were informed through a series of emails that the Library was participating in LibQUAL+ and were invited to participate. Thank you to those who completed surveys. And congratulations to our student winners:
Representativeness and Response Rate
A representative sample of the student population was selected and emailed a survey invitation. 5,000 undergraduates, and 2,125 graduate students were included in the sample. In addition all faculty were invited. In total, 1,072 respondents started the survey and 975 of those respondents completed the survey, for an overall response rate of about 12.7%. This rate is similar to earlier LibQual+ iterations.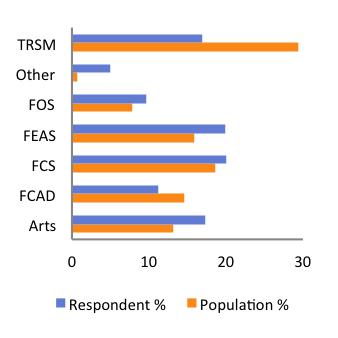
Improvement in Overall Scores
Comparison of LibQual+ Overall Dimensions 2007 through 2016
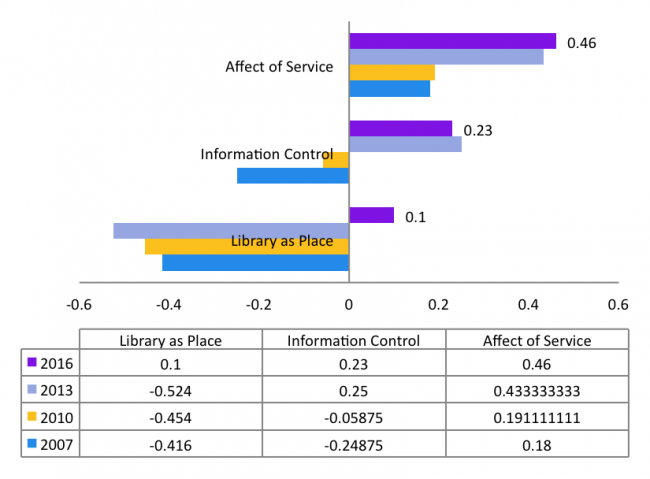
The most dramatic improvement to our LibQual+ survey scores is within the Library as Place Dimension. We also see a modest improvement in Affect of Service. A slight decline in Information Control was identified in the provision of print collections and journal collections needed for patrons’ work.
Open-ended Comments
365 LibQual+® respondents left text in the comment box. 331 of those included enough information to code for further analysis. The majority of these were from undergraduate students. 32% of undergraduates left us a comment. 43% of graduate student participants, and 53% of faculty participants also made use of the comment box. Respondents from each faculty left comments at a similar rate.
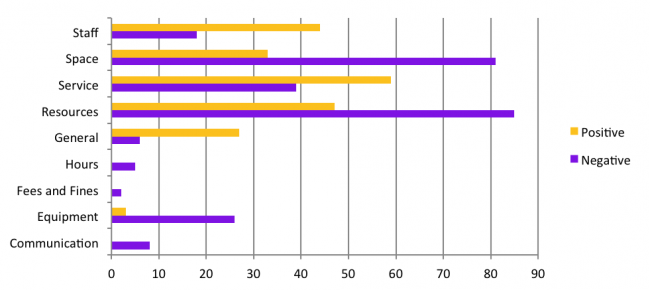
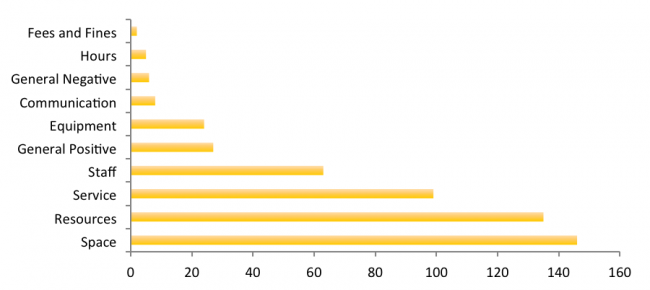
Unsurprisingly, survey participants commented most on the major aspects of the LibQual+® survey instrument: space, resources, and service. However, unlike previous iterations (2013, 2010, 2007), participants commented about resources almost as frequently as they commented about our space, whereas in previous years, comments about space dwarfed other issues. This may be explained in part by the opening of the Student Learning Centre, which several participants commented positively about. The chart below illustrates the frequency of comments by theme.
As in previous LibQual +® iterations, the majority of comments about staff and service were positive in nature, while space and resources comments are less positive. Comments were interpreted as negative if they were explicitly indicating quality is lacking, or if more space or resources were needed. A single comment could include both a positive and negative element, so the categories here are not entirely mutually exclusive. Compared with 2013, the proportion of negative to positive comments about space is much better (fewer negative comments). In 2013, only 8% of the comments we received about space were positive, while this year we see closer to 22% (there were a total of 148 comments about space).